Background
Introduction
The GroundWater Spatiotemporal Data Analysis Tool (GWSDAT) has been developed by Shell Global Solutions for the analysis of groundwater monitoring data. It is designed to work with simple time-series data for solute concentration and ground water elevation, but can also plot non-aqueous phase liquid (NAPL) thickness if required.
Spatial data is input in the form of well coordinates, and wells can be grouped to separate data from different aquifer units. The software also allows the import of a site basemap in GIS shapefile format. Concentration trend and 2D contour plots generated using GWSDAT can be exported directly to Microsoft PowerPoint and Word to expedite reporting.
Software Architecture
The application is supported for Windows 8 & 10 and the corresponding version of Microsoft Office (including 64-bit operating systems). Data input to GWSDAT is via a standardized Excel spreadsheet and the data analysis and plot functions are accessed through an Excel Add-in application.
The statistical engine used to perform geo-statistical modelling and display graphical output is the open- source statistical programming language R (www.r-project.org). A user manual and two example datasets are provided with the software for training and demonstration purposes.
Spatiotemporal Data Analysis
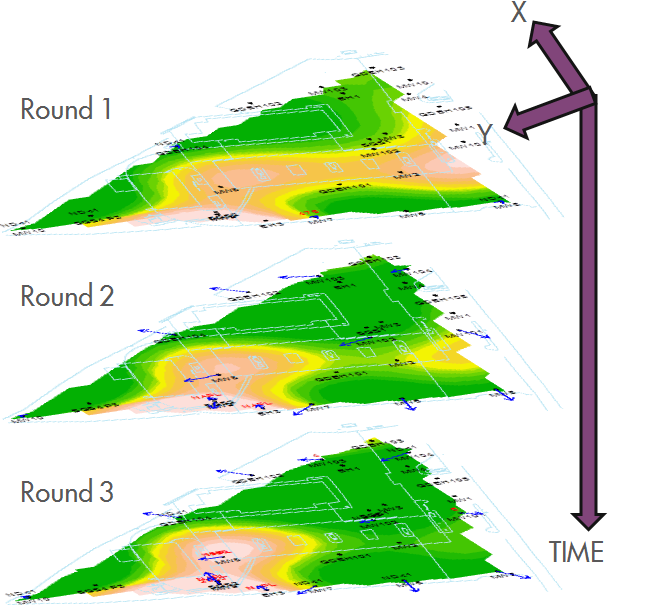 The modelling of solute distribution in groundwater is typically restricted to either the analysis of trends in individual wells or independent fitting of spatial concentration distributions (e.g. by Kriging) to data from monitoring events. Neither of these techniques satisfactorily elucidate the interaction between spatial and temporal components of the data.
GWSDAT applies a spatiotemporal model smoother for a more coherent and smooth interpretation of the interaction in spatial and time-series components of groundwater solute concentrations. A spatiotemporal concentration smoother is fitted for each analyte using a non-parametric regression technique known as Penalised Splines (Eilers and Marx, 1992, 1996).
A Bayesian methodology is used to select the appropriate degree of model smoothness (Evers et al, 2015). The fit of the spatiotemporal algorithm to the monitoring data can be evaluated.
Graphical User Interface
 The GWSDAT graphical user interface (GUI) allows the user to navigate through a groundwater dataset and explore concentration/ groundwater elevation trends in individual wells and across the site.
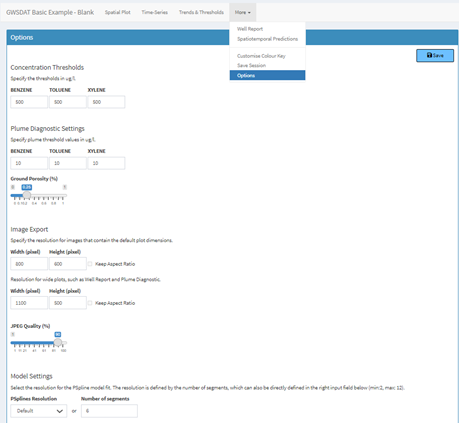
Several options are available to customize the display and data analysis. Note that plots can also be automatically exported.
Data Visualisation
GWSDAT includes the following tools for trend visualization and detection:
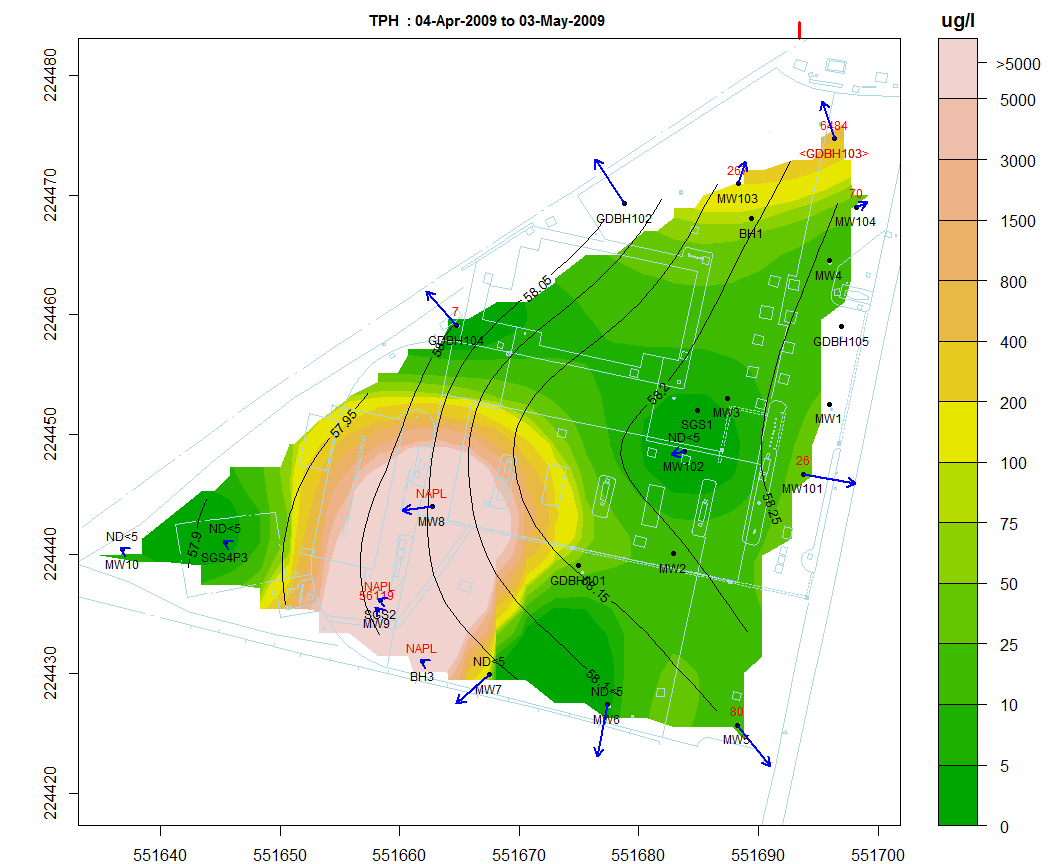
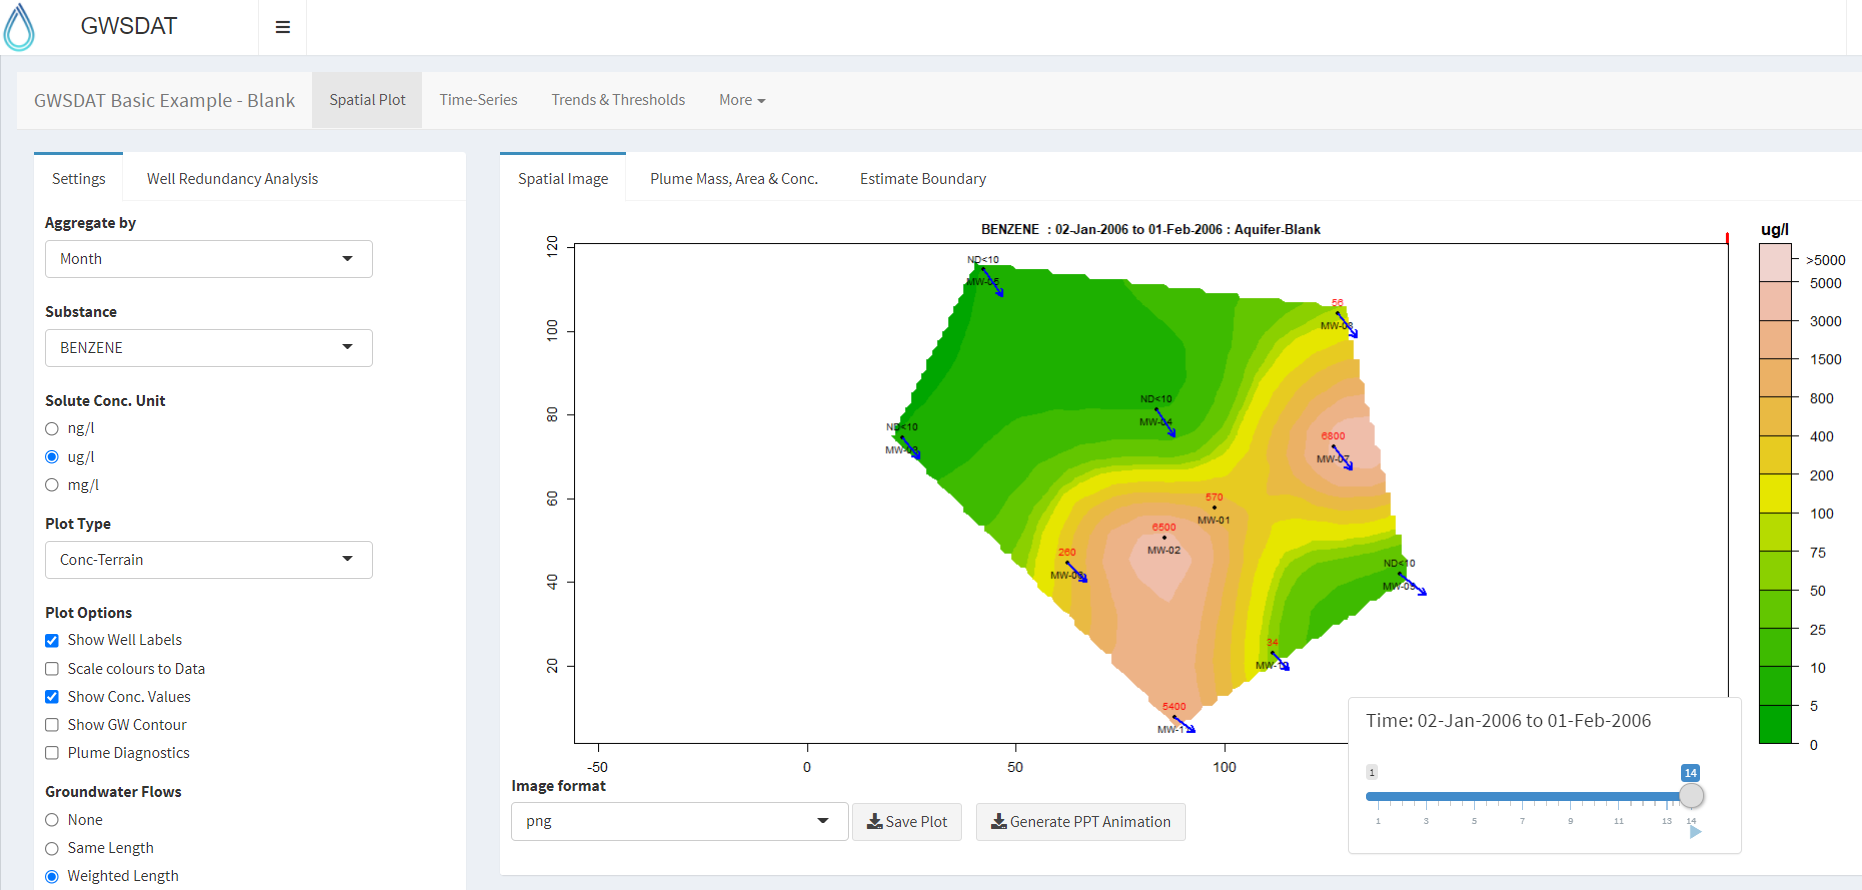
Spatial plot:
For the analysis of spatial trends in solute concentrations, groundwater flow and, if present, NAPL thickness.
Overlaid on this plot are the predictions of the spatiotemporal solute concentration smoother which is a function that simultaneously estimates both the spatial and time series trend in site solute concentrations.
GIS shapefiles can also be overlaid on this plot.
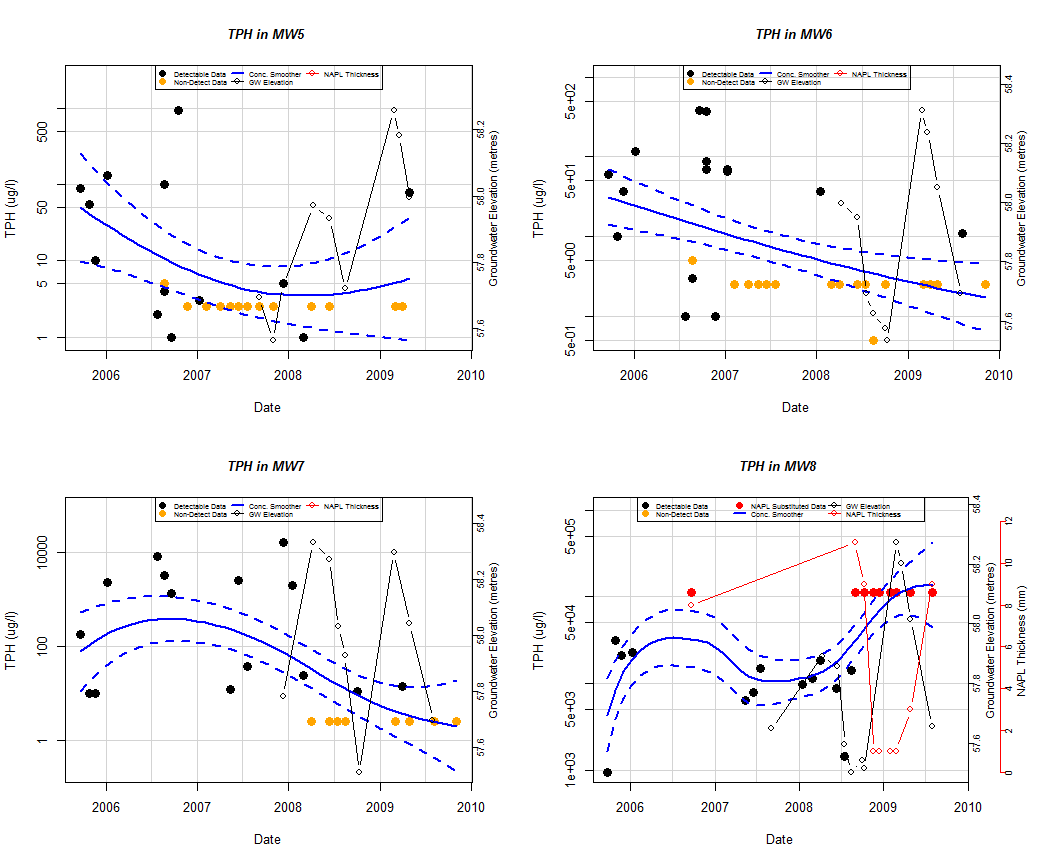
Well Trend plot:
For the investigation of historical time-series trends in solute concentrations, groundwater elevation and, if present, NAPL thickness for individual wells.
Users can overlay a nonparametric smoother which estimates the time-series trend in solute concentration.
The advantage of this nonparametric method is that the trend estimate is not constrained to be monotonic, i.e. the trend can change direction.
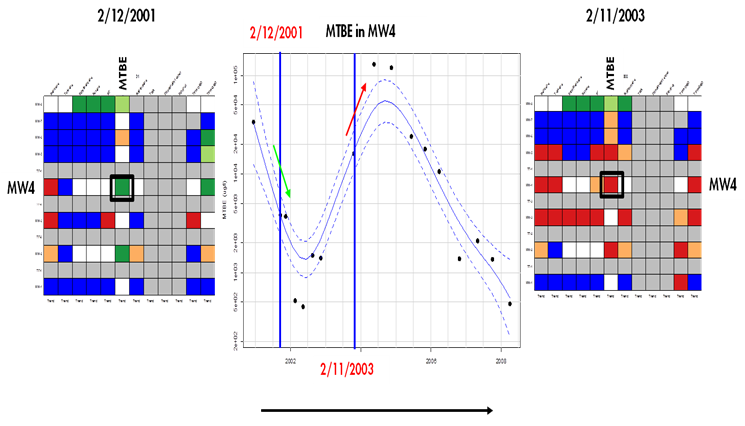
Trend and Threshold Indicator Matrix:
This feature provides a summary of the level and time series trend in solute concentrations at a particular model output interval.
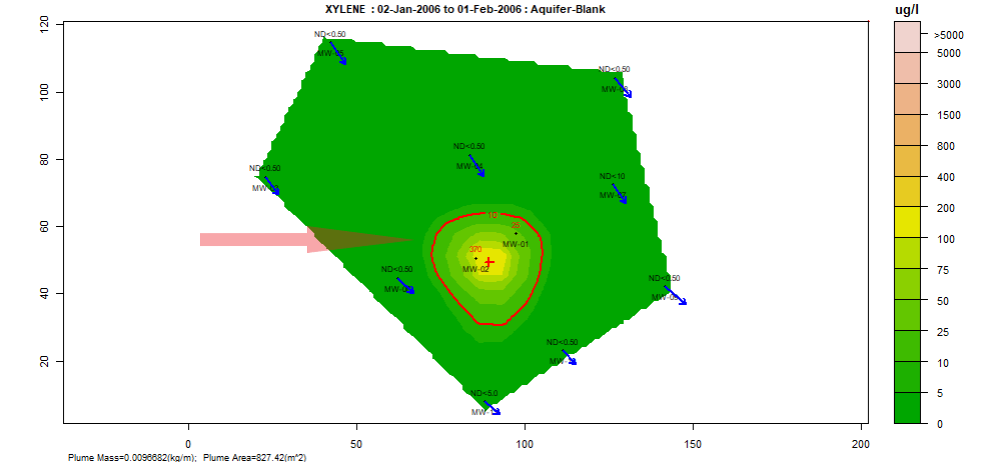
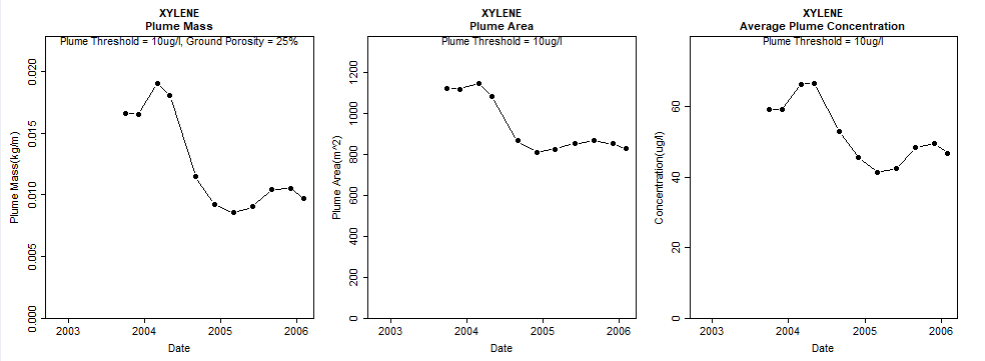
Plume diagnostics plots:
This feature enables the user to calculate and display plume diagnostic quantities (area, mass, concentration) for a delineated plume displayed with a solid red contour line.
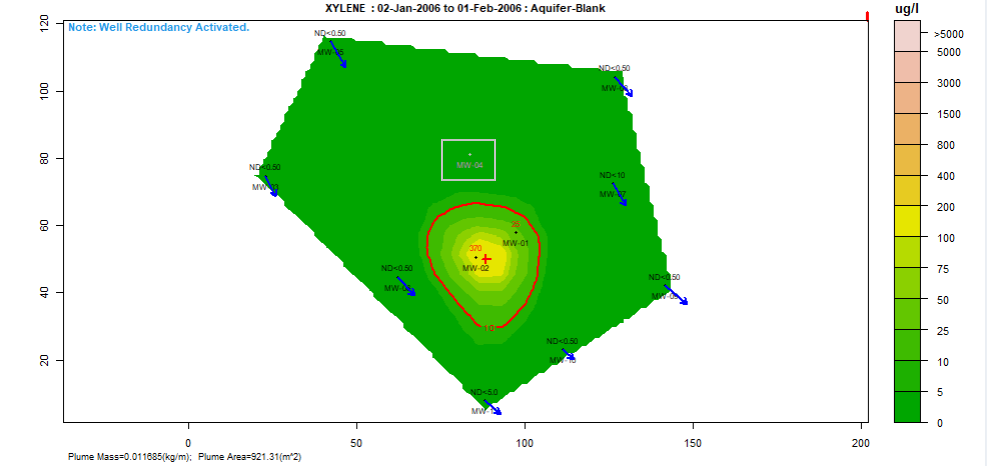
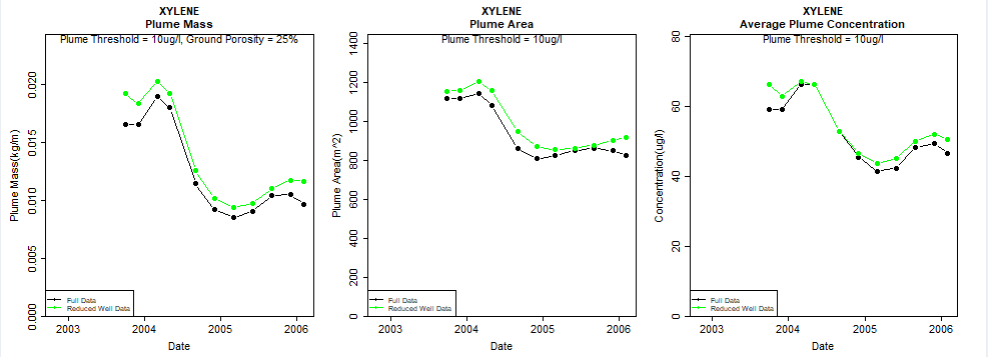
Well redundancy:
This feature enables the user to very conveniently drop a well or a combination of wells from the analysis and investigate the resultant impact.
Installation Instructions
System Requirements: Windows 8 or 10. Microsoft Office versions: 365, 2016, 2013, 2010. You need to be connected to the internet when you install GWSDAT version 3.2.
- Download and install the latest version of the open source statistical application "R" available from: http://cran.r-project.org/bin/windows/base/ . Please accept all default settings during installation. (Users must have administrator access rights to install R).
- Download the GWSDAT_v3.20.zip file from http://gwsdat.net/gwsdat_v3-20/ and unzip to somewhere on your C: Drive which is read/writable, e.g. C:\Users\A.N.Other\GWSDAT.
- Open Excel and install the GWSDAT add-in by choosing: "File" -> "Options" -> "Add-Ins" -> "Go" -> "Browse" and then select "GWSDAT V3.20.xlam" located in the "C:\Users\A.N.Other\GWSDAT_v3.20" folder. To avoid any Excel add-in security issues please ensure that this is a trusted location. See link here for troubleshooting Excel Add-in installation issues.
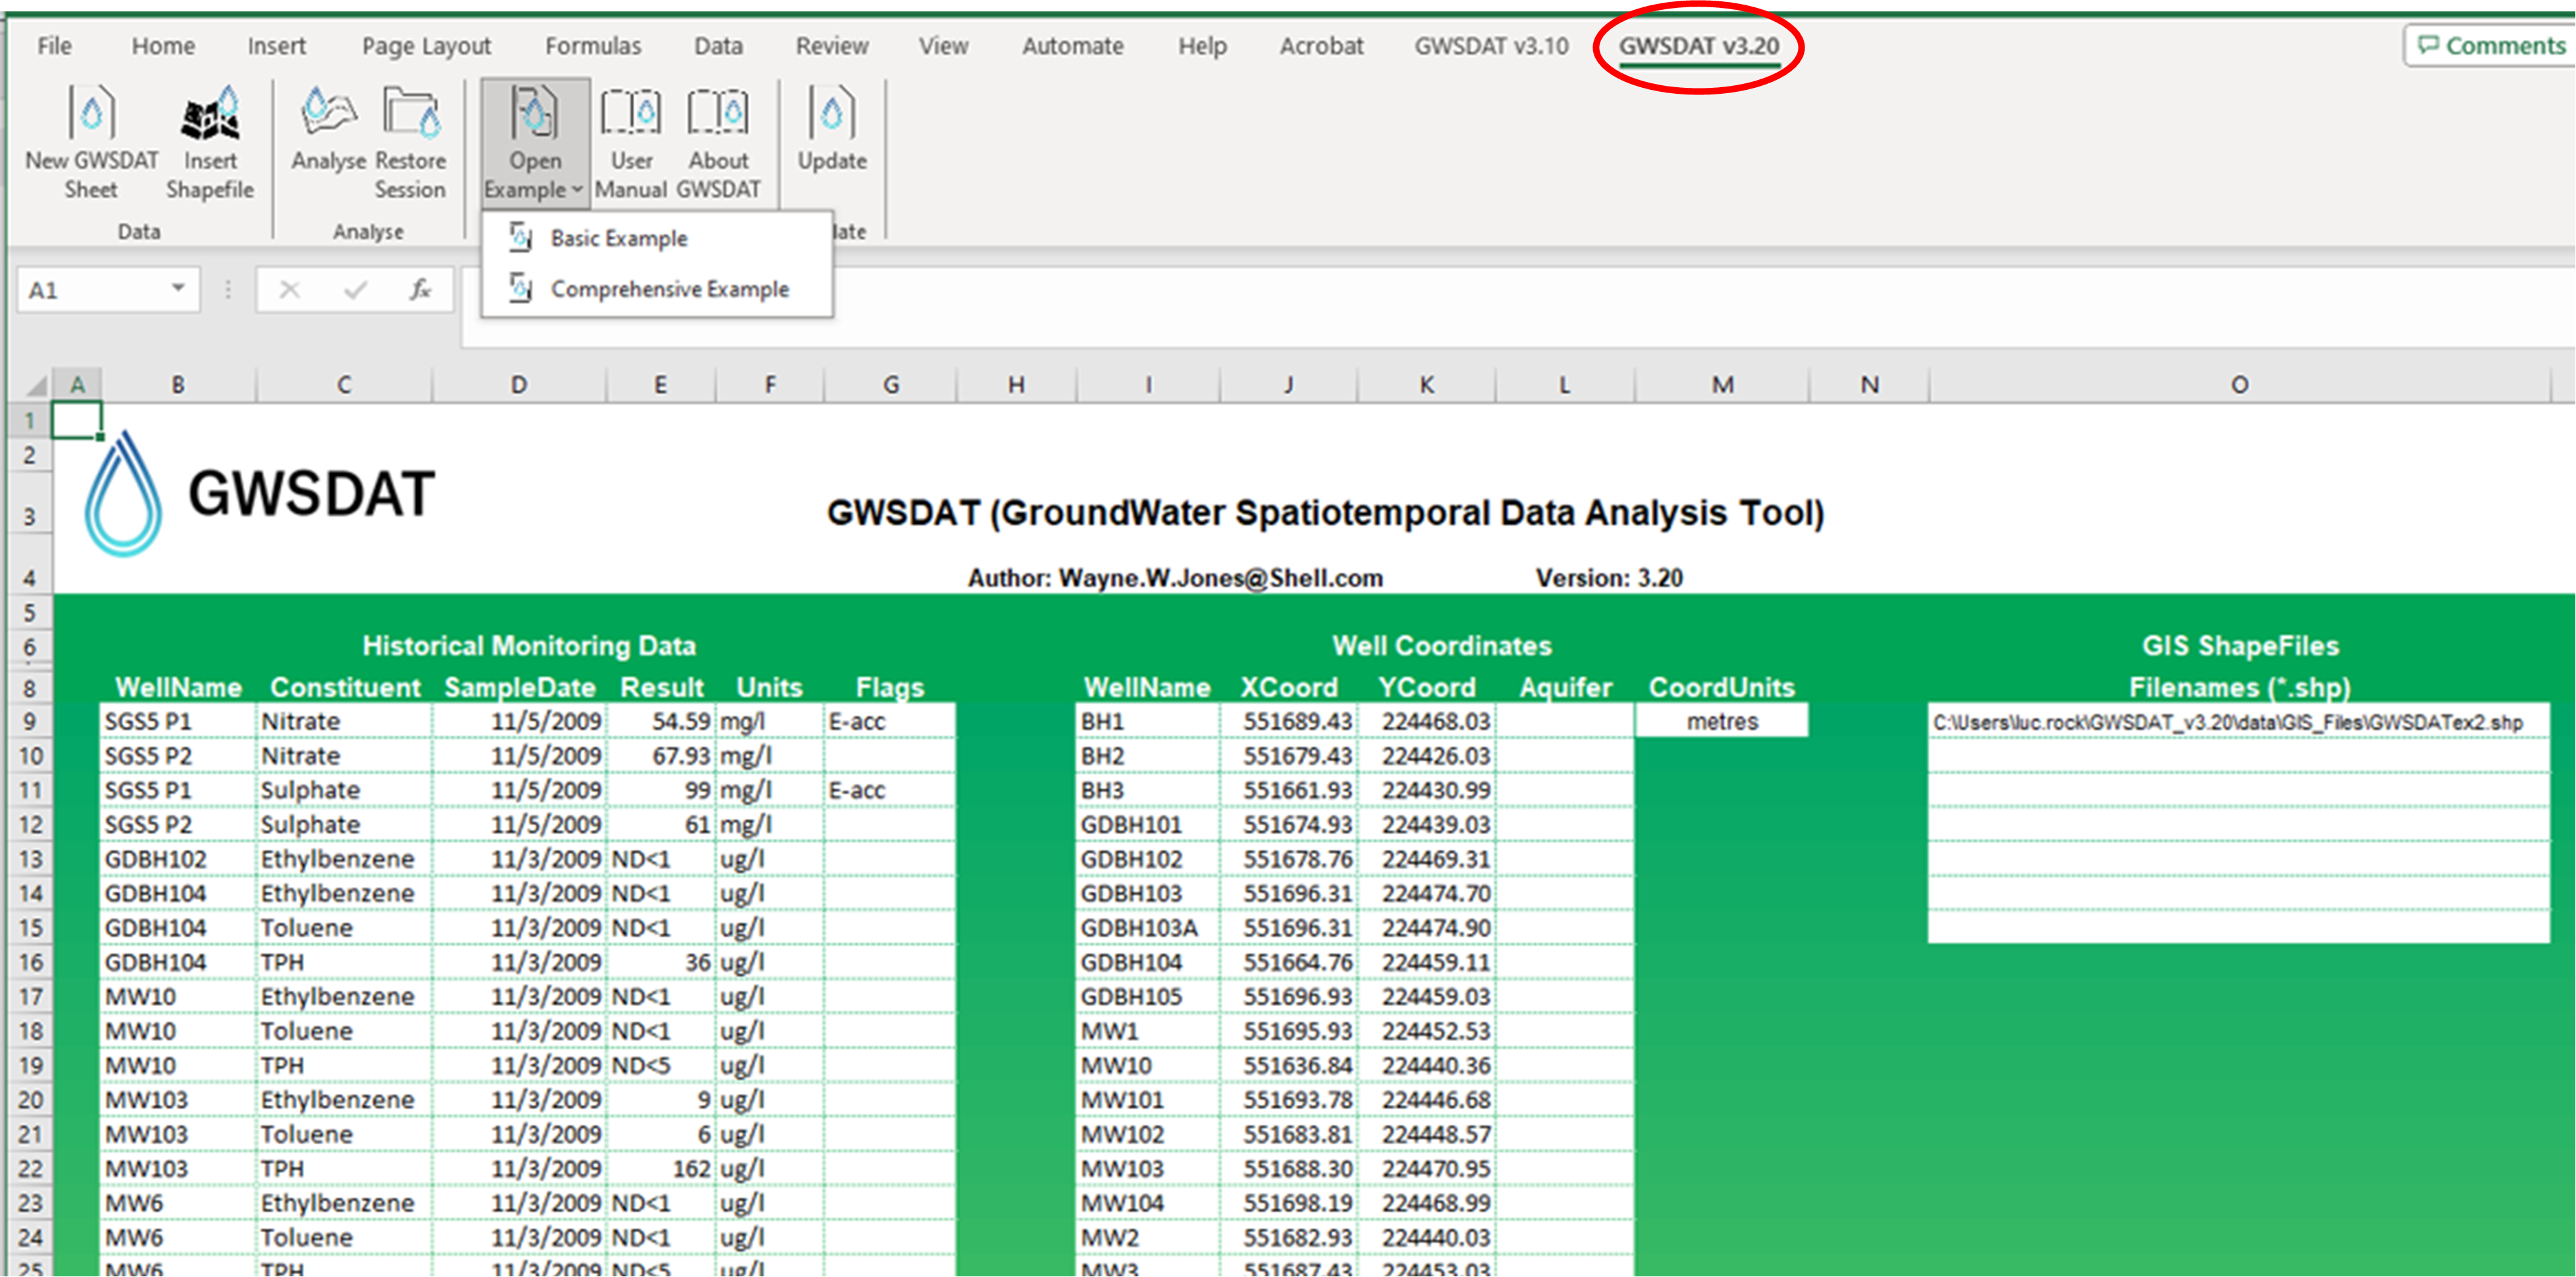
- A menu called "GWSDAT v3.20" will appear in the EXCEL ribbon (on right side) along the top of the EXCEL window.
Getting started
- To get started with a basic example activate menu by clicking on “GWSDAT v3.20”and then select “Open Example” > select “Basic Example" and then select "Analyse”.
- Note- the first time you run this it may take a while as it needs to download and install some additional R packages.
- To get started with a more complex example activate menu by clicking on “GWSDAT v3.20”and then select “Open Example” > select “Comprehensive Example”, and then select "Analyse”.